Observability & Telemetry (OTLP)
Beeceptor provides comprehensive observability for your mock servers through OpenTelemetry Protocol (OTLP) support. This enterprise feature lets you export distributed traces from every request to your mock endpoints to your preferred observability platform, whether it is a self hosted solution or a SaaS vendor.
This feature is available with the Enterprise plan.
Why Observability?
API mocking is a critical part of testing and integration workflows. Without observability, mock servers become blind spots in your distributed system. Adding telemetry to mock endpoints provides:
- Distributed Tracing Correlation: Trace IDs propagate through mock responses, allowing you to connect test runs with specific mock behaviors in your APM dashboards
- Performance Baselines: Measure response times, payload sizes, and latency percentiles to identify slow rules or misconfigured proxies before they impact test pipelines
- Request Volume Metrics: Track request counts, error rates, and status code distributions per endpoint to understand usage patterns and detect anomalies
- Failure Diagnosis: Pinpoint which rule matched, whether an upstream callout failed, and the exact error codes returned—all in one trace view
Beeceptor's OTLP integration exports this trace data directly to your observability stack (Jaeger, Grafana Tempo, Datadog, etc.). This is is built on OpenTelemetry, the industry-standard for distributed tracing. This means:
- Vendor-agnostic: Works with any OTLP-compatible backend (Jaeger, Tempo, Datadog, Honeycomb, etc.).
- Standardized format: Uses OpenTelemetry Protocol (OTLP) over HTTP.
- No lock-in: Switch observability platforms without changing Beeceptor configuration.
- Safe by design: Only exports relevant metrics - no internal implementation details or stack traces.
Configuration
Setting up observability requires configuring an OTLP endpoint where Beeceptor will export trace data. This is a one-time setup at the organization level. Once configured, all endpoints within your organization automatically emit traces.
Step 1: Access Observability Settings
Navigate to the observability settings as an organization admin:
- Click on Manage Organization from the top navigation bar
- Select the Observability tab from the settings menu
- Toggle Enable Observability to activate trace exports
Once enabled, Beeceptor will start exporting traces for every request hitting your mock endpoints.

Step 2: Configure OTLP Endpoint
The OTLP endpoint URL determines where Beeceptor sends trace data. This should point to an OTLP-compatible collector or directly to your observability platform's ingestion endpoint.
OTLP Endpoint URL
Enter the full URL of your OTLP receiver. Beeceptor uses HTTP transport and automatically appends /v1/traces to the path if not already present.
Example endpoint URLs:
| Platform | Endpoint URL |
|---|---|
| Self-hosted Collector | http://your-server-ip:4318/v1/traces |
| New Relic | https://otlp.nr-data.net |
| Honeycomb | https://api.honeycomb.io |
| Grafana Cloud | https://otlp-gateway-<region>.grafana.net/otlp |
Authentication & Custom Headers
Most observability platforms require authentication via HTTP headers. Add the headers your backend expects. These are sent with every trace export request from Beeceptor.
| Header | Value | Used By |
|---|---|---|
x-api-key | Your API key | Generic OTLP backends |
DD-API-KEY | Your Datadog API key | Datadog |
Authorization | Basic <base64-credentials> | Grafana Cloud, basic auth |
x-honeycomb-team | Your team API key | Honeycomb |
Step 3: Save & Verify
After entering your endpoint and authentication details:
- Click Save to apply the configuration
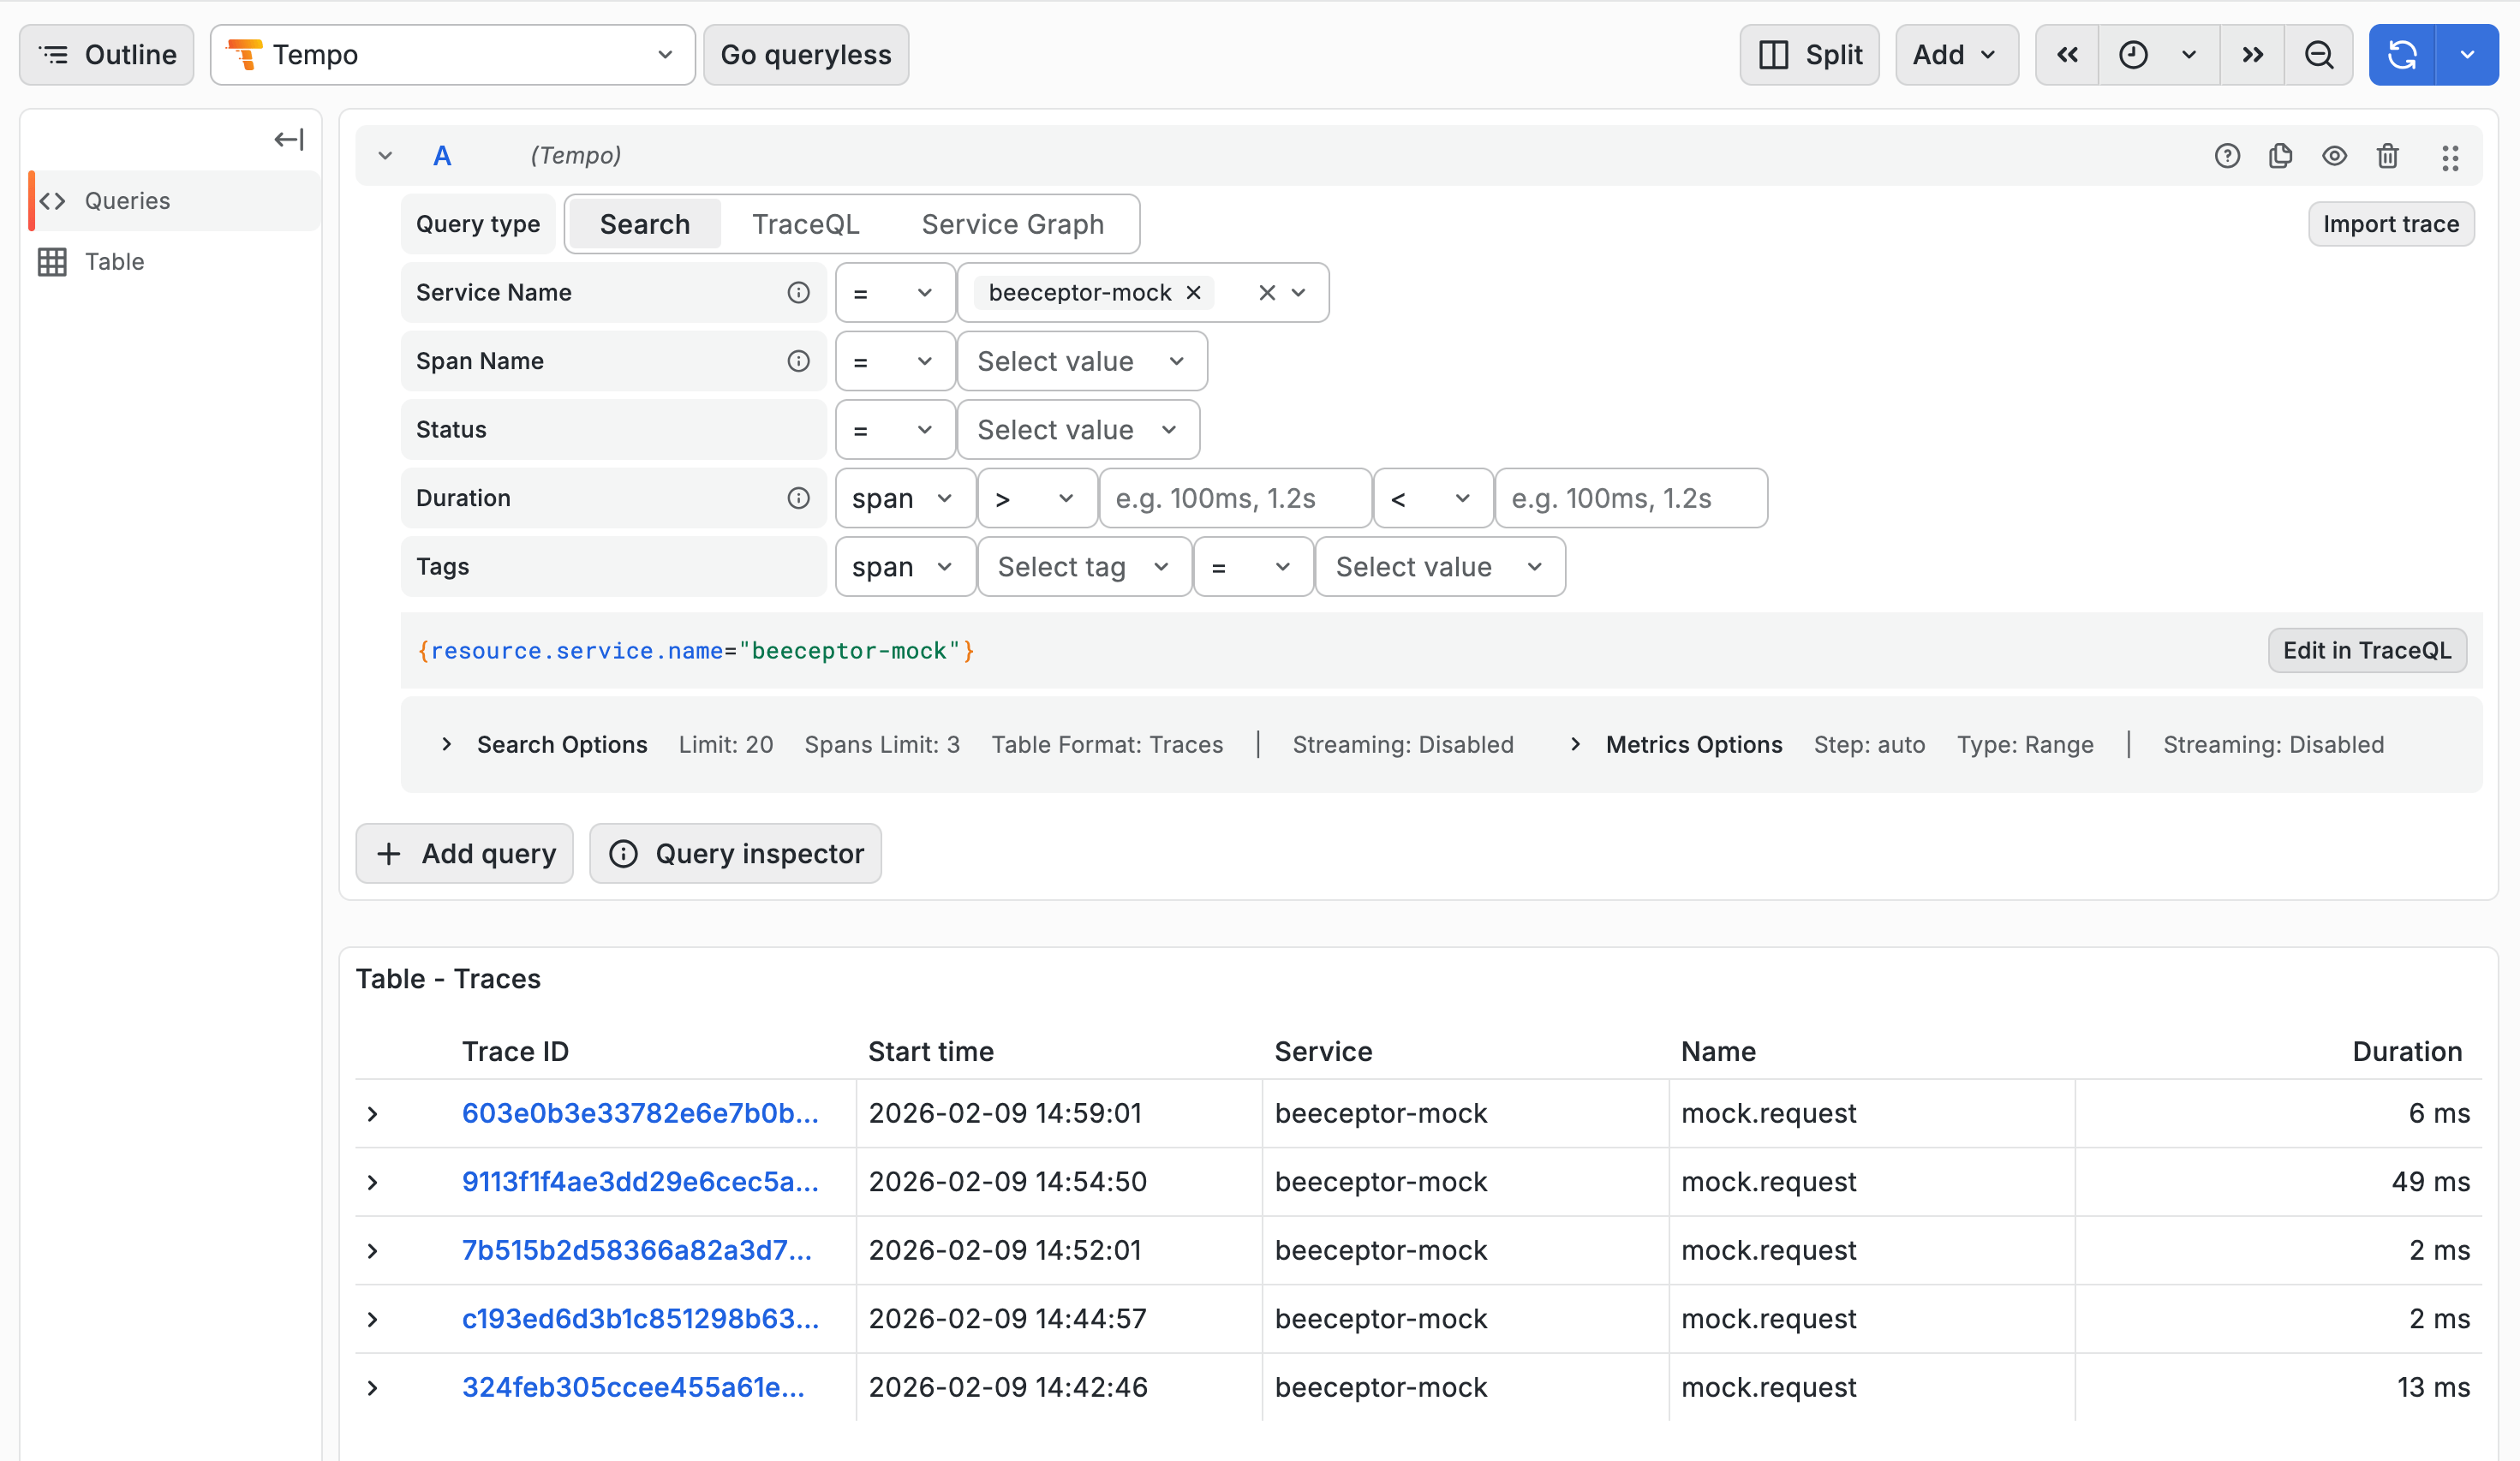
- Send a test request to any endpoint in your organization (e.g.,
curl https://your-endpoint.proxy.beeceptor.com/test) - Open your observability platform and search for traces with
service.name = beeceptor-mock
If traces appear within a few seconds, your configuration is working. If not, verify your endpoint URL and authentication headers.
Traced Data
Every HTTP request to your mock server generates a distributed trace. Each trace contains a root span representing the full request lifecycle, along with child spans for specific operations like rule evaluation and upstream calls.
Root Span:
The root span is named mock.request. It captures the complete request-response cycle. It includes metadata about the incoming request, the matched rule (if any), and the final response.
Request Attributes
| Attribute | Description |
|---|---|
service.name | Always beeceptor-mock for identification in your APM |
endpoint.name | Your Beeceptor endpoint name (e.g., my-api) |
http.method | HTTP method (GET, POST, PUT, etc.) |
http.target | Request path (e.g., /users/123) |
http.scheme | Protocol used (http or https) |
http.host | Value of the Host header |
http.client_socket.address | Client IP address |
request.id | Unique identifier for correlating logs |
Response Attributes
| Attribute | Description |
|---|---|
http.status_code | HTTP status code returned to the client |
http.request.body.size | Size of the request payload in bytes |
http.response.body.size | Size of the response payload in bytes |
request.duration_ms | Total time from request received to response sent |
Rule Matching Attributes
| Attribute | Description |
|---|---|
rule.matched | true if a mock rule matched, false otherwise |
rule.id | ID of the matched rule (useful for debugging) |
rule.type | Type of rule: mock, callout, crud, etc. |
response.type | How the response was generated: mock, proxy_global, local_tunnel, oas, graphql, etc. |
Proxy Attributes (when applicable)
This span is available when the rule matched has an external HTTP callout.
| Attribute | Description |
|---|---|
proxy.target | Upstream URL (partially obfuscated for security) |
proxy.upstream_status | HTTP status code from the upstream service |
proxy.latency_ms | Time taken by the upstream call |
Child Spans
Child spans provide granular visibility into specific operations within the request lifecycle.
rule.evaluation
This span captures the rule matching phase. Use it to understand how many rules were evaluated and which one (if any) matched the incoming request.
| Attribute | Description |
|---|---|
rules.count | Total number of rules evaluated |
rule.matched | Whether any rule matched |
rule.id | ID of the matched rule |
proxy.upstream
Created when a proxy or callout rule forwards the request to an external service. This span helps you measure upstream latency and detect failures in your backend dependencies.
| Attribute | Description |
|---|---|
http.method | HTTP method used for the upstream call |
http.status_code | Response status from the upstream service |
http.response.body.size | Size of the upstream response |
upstream.latency_ms | Time taken by the upstream service |
error | true if the upstream call failed |
tunnel.upstream
Created when requests are forwarded through Beeceptor's local tunnel to a service running on your machine. This span is useful for debugging connectivity issues between Beeceptor and your local development environment.
| Attribute | Description |
|---|---|
http.status_code | Response status from your local service |
http.response.body.size | Size of the response |
upstream.latency_ms | Response time from your local service |
upstream.timeout | true if the tunnel request timed out |
error.type | Error code if the connection failed (e.g., ECONNREFUSED) |
SaaS Platforms (Setup)
Beeceptor exports traces over HTTP using the OTLP protocol. Most SaaS observability platforms accept OTLP data directly. Below are setup instructions for common platforms.
| Service | Details |
|---|---|
| New Relic | Requires api-key header with your New Relic license key. Refer to New Relic OTLP integration guide for setup. |
| Datadog | Requires DD-API-KEY header with your API key. Refer to Datadog OTLP Ingestion documentation for endpoint configuration and setup instructions. |
| Grafana Cloud | Requires Authorization header with base64-encoded instanceID:token. See Grafana Cloud OTLP documentation for endpoint URLs by region. |
| Honeycomb | Requires x-honeycomb-team header with your API key and x-honeycomb-dataset header to specify your dataset. See Honeycomb OTLP documentation for details. |
| Lightstep | Requires lightstep-access-token header with your access token. See Lightstep OTLP documentation for configuration details. |
FAQ
Q: Does this work with the Free plan?
A: No, observability features are only available with the Enterprise plan.
Q: Can I send traces to multiple backends?
A: Yes, use an OTLP Collector with multiple exporters configured.
Q: Are request/response bodies captured?
A: No, only metadata (headers, status codes, sizes) are captured for security and performance.
Q: How long are traces retained?
A: Retention is determined by your observability backend (Tempo, Jaeger, etc.), not Beeceptor.
Q: Can I disable telemetry for specific endpoints?
A: Telemetry is configured at the organization level and applies to all endpoints in that organization.