Simulate Latency Under High Load
When you are doing performance testing, how do you model real-world scenarios? For example, an upstream API may respond quickly under normal traffic but slow down as traffic increases. You can virtualize that API, but testing with a fixed delay does not reproduce this behavior. In this tutorial, Beeceptor simulates an upstream API and increases its added response delay from 0 to 750 milliseconds as the request rate increases.
Beeceptor calculates the added delay from a configured latency profile, giving you a controlled way to simulate a dependency slowing down under load. This tutorial compares linear and step profiles and shows how each appears in the performance test results.
Performance Testing Setup
When testing an application under load, you may have limited visibility into or control over its upstream dependencies. In this example, the application connects to a CRM service to fetch customer data. The load generator sends requests to the application, which then calls the CRM service.
This tutorial assumes that each request to the application’s /api/customers route makes exactly one upstream CRM request to /api/customers, with no caching or retries. It also assumes that no other traffic reaches the Beeceptor endpoint. Under these conditions, the application request rate matches the rate received by Beeceptor. RPS means requests per second.
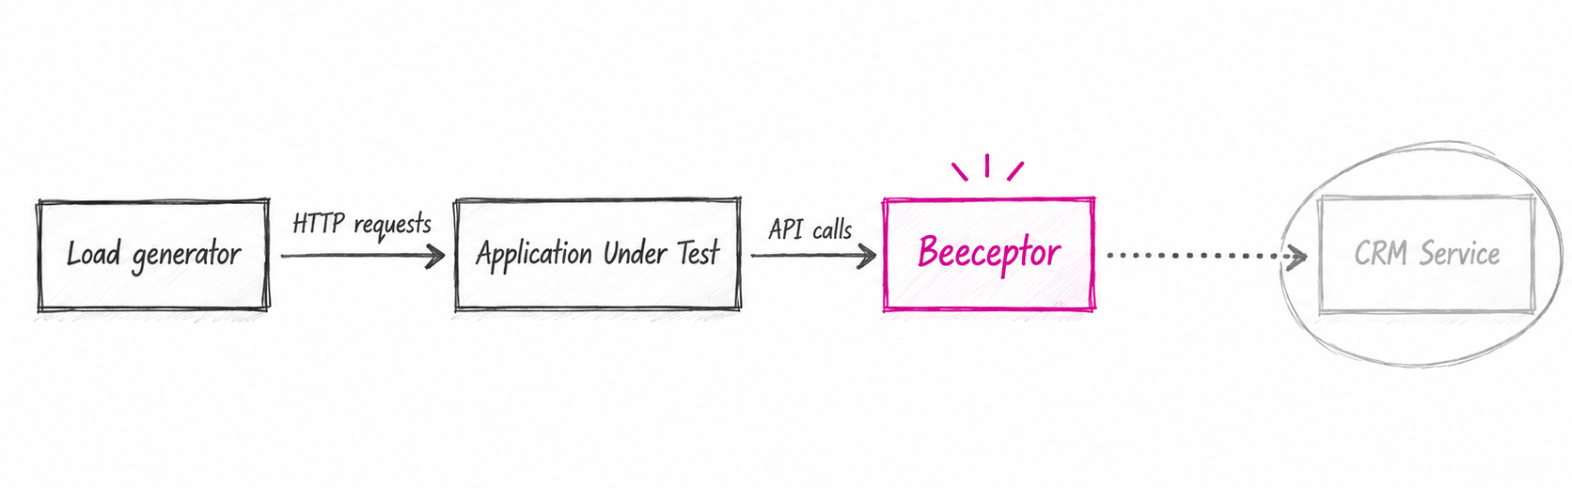
In this virtualized setup, Beeceptor replaces the CRM service while preserving its API contract and serves the mock responses. The real CRM service is not called. Beeceptor can add a fixed delay, such as 0 or 500 ms, or a random delay between 0 and 1,000 ms. These delays are reflected in your performance test results.
Here, we will make the added latency depend on the request rate received by Beeceptor. Higher request rates will produce longer delays, allowing you to observe how your application responds as its dependency slows down. The values below are illustrative; you can adjust them to reflect measurements from your production CRM service.
Configure
Prerequisites
You need:
- An application with a
/api/customersroute that calls a CRM service. - A Beeceptor endpoint on a Scale or Enterprise plan that supports request-rate-based latency.
- Access to configure mock rules in Beeceptor.
- Access to change the application’s CRM base URL in your application under test (a Dev/Ops can help).
- A load generator. The runnable example below uses k6, but the Beeceptor configuration works with other load-testing tools.
This walkthrough uses a Beeceptor endpoint named crm-load-test. Replace it with your own endpoint name.
Connect your application to Beeceptor
Set the application’s CRM base URL to your Beeceptor endpoint’s base URL. Your development or operations team can help update this configuration. The application will then send its CRM requests to Beeceptor and receive mock responses that follow the same API contract.
In Beeceptor, create a mock rule that matches GET /api/customers. Configure it to return a 200 response with the customer JSON body and content type your application expects from the CRM service. Set the response latency to Inherit endpoint so the rule uses the latency profile configured below. A Fixed delay would override that profile. See mock rule latency settings for details.
For this example, the application’s upstream request will go to:
https://crm-load-test.proxy.beeceptor.com/api/customers
Before generating load, send a GET /api/customers request to your application. Verify that the corresponding upstream request appears in Beeceptor’s request log and that the application returns the expected response.
Set up the latency curve
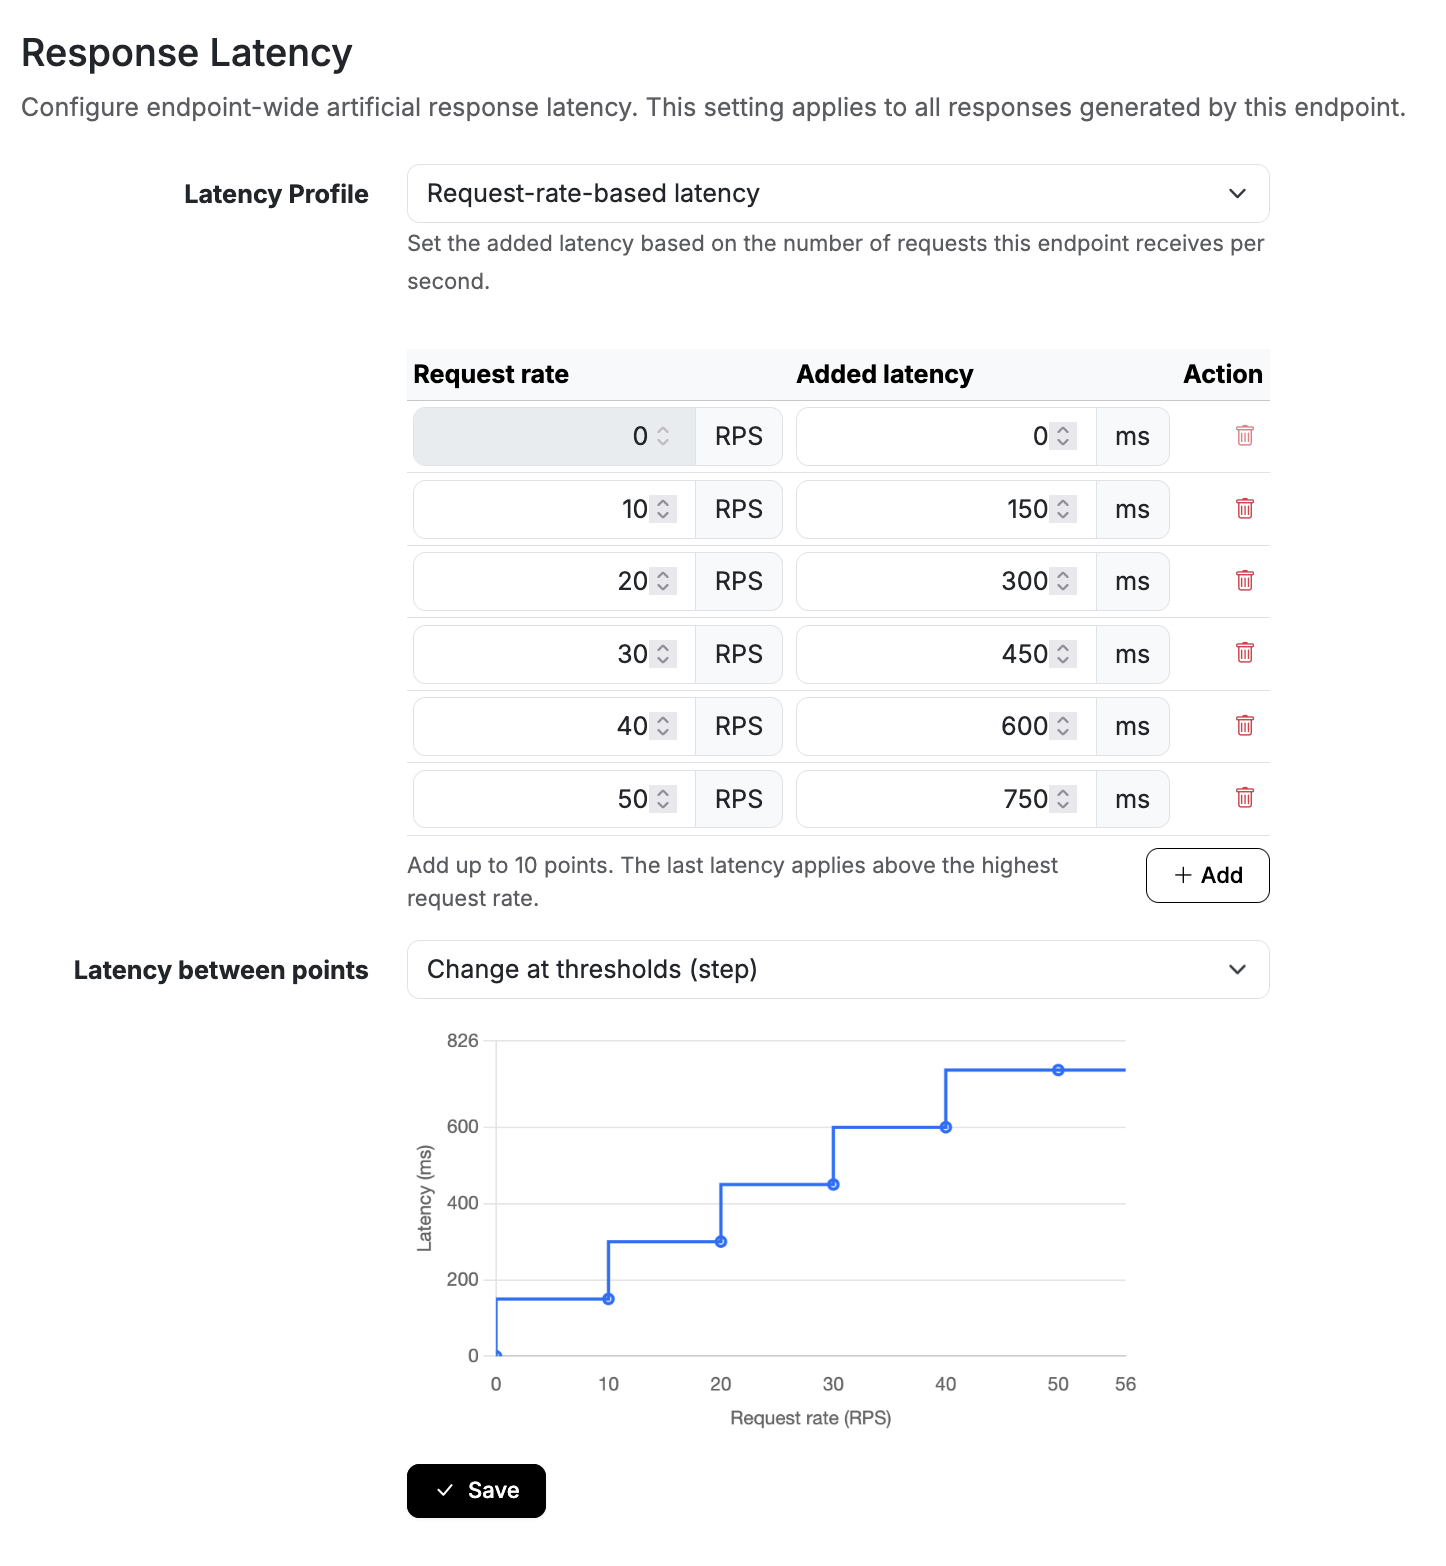
In Beeceptor, open Endpoint Settings, select Runtime Behavior, and scroll to Response Latency. Choose Request Rate Based, then enter these request-rate/latency pairs:
 0 RPS with 0 ms
10 RPS with 150 ms
20 RPS with 300 ms
30 RPS with 450 ms
40 RPS with 600 ms
50 RPS with 750 ms
For the first run, select Gradual change (linear) and save. Between two points, Beeceptor calculates a proportional delay. At 25 RPS, for example, the configured added latency is 375 ms. The second run will use the same points with Change at thresholds (step). Step mode holds the previous value until the next threshold is reached. At 25 RPS it adds 300 ms, then changes to 450 ms only at 30 RPS.
Beeceptor calculates the request rate using the average of the previous two completed one-second intervals, excluding the current interval. A traffic spike or drop therefore affects the added latency after a short delay, rather than immediately for each incoming request. See Latency Profiles for the calculation details.
Generate the load
This example uses k6 to produce a controlled ramp. Create a file named load-based-latency.js:
import http from 'k6/http';

const baseUrl = (__ENV.BASE_URL || '').replace(/\/$/, '');
const targetPath = __ENV.TARGET_PATH || '/api/customers';

if (!baseUrl) {
  throw new Error(
    'BASE_URL is required, for example https://your-application-url.com',
  );
}

export const options = {
  discardResponseBodies: true,
  scenarios: {
    continuous_ramp: {
      executor: 'ramping-arrival-rate',
      startRate: 0,
      timeUnit: '1s',
      startTime: '2s',
      preAllocatedVUs: 120,
      maxVUs: 160,
      stages: [
        { target: 52, duration: '240s' },
        { target: 52, duration: '120s' },
        { target: 0, duration: '240s' },
      ],
      gracefulStop: '5s',
    },
  },
};

export default function () {
  http.get(`${baseUrl}${targetPath}`);
}
The ramping-arrival-rate executor starts iterations independently of response duration. Each iteration makes one request in this script, keeping the generated request rate aligned with the configured traffic curve as long as enough virtual users are available. Check that k6 reports no dropped_iterations before interpreting the results.
The load profile spans ten minutes, following a two-second start delay:
- Ramp from
0to52RPS over four minutes. - Hold at
52RPS for two minutes. - Ramp back to
0RPS over four minutes.
Set BASE_URL to your application’s base URL, then run the test and export a standalone HTML report:
env \
  K6_WEB_DASHBOARD=true \
  K6_WEB_DASHBOARD_EXPORT=load-dependent-linear-report.html \
  K6_WEB_DASHBOARD_PERIOD=5s \
  K6_WEB_DASHBOARD_OPEN=true \
  BASE_URL=https://your-application-url.com \
  TARGET_PATH=/api/customers \
  k6 run load-based-latency.js
After the linear run finishes, switch the Beeceptor profile to Change at thresholds (step) and save, keeping the same rate/latency pairs. Run the same command again with K6_WEB_DASHBOARD_EXPORT=load-dependent-step-report.html to keep the reports separate.
Results
The results below show two runs with the same k6 script and traffic profile: one with linear mode and one with step mode.
Configuring 0 ms means Beeceptor adds no intentional delay; it does not mean the client measures a zero-duration request. Both runs show a baseline of approximately 260 ms, which includes network time, application processing, and other test-environment overhead. Your baseline may differ.
Gradual change (linear)
With the linear profile, request duration rises continuously with request rate until the configured cap is reached. In this run, the load generator completed 18,719 requests with no failed requests reported by k6. Using the observed baseline, the expected approximate relationship is:
request duration ≈ 260 ms + min(15 × RPS, 750) ms
Here, RPS is the rate calculated by Beeceptor. Up to 50 RPS, the added delay increases by 15 ms for each additional 1 RPS. At and above 50 RPS, the delay is capped at 750 ms. Although the test reaches 52 RPS, request duration therefore plateaus at approximately 1,010 ms with this baseline. As the rate falls below 50 RPS, the added delay decreases again, subject to the short lag in Beeceptor’s RPS calculation.
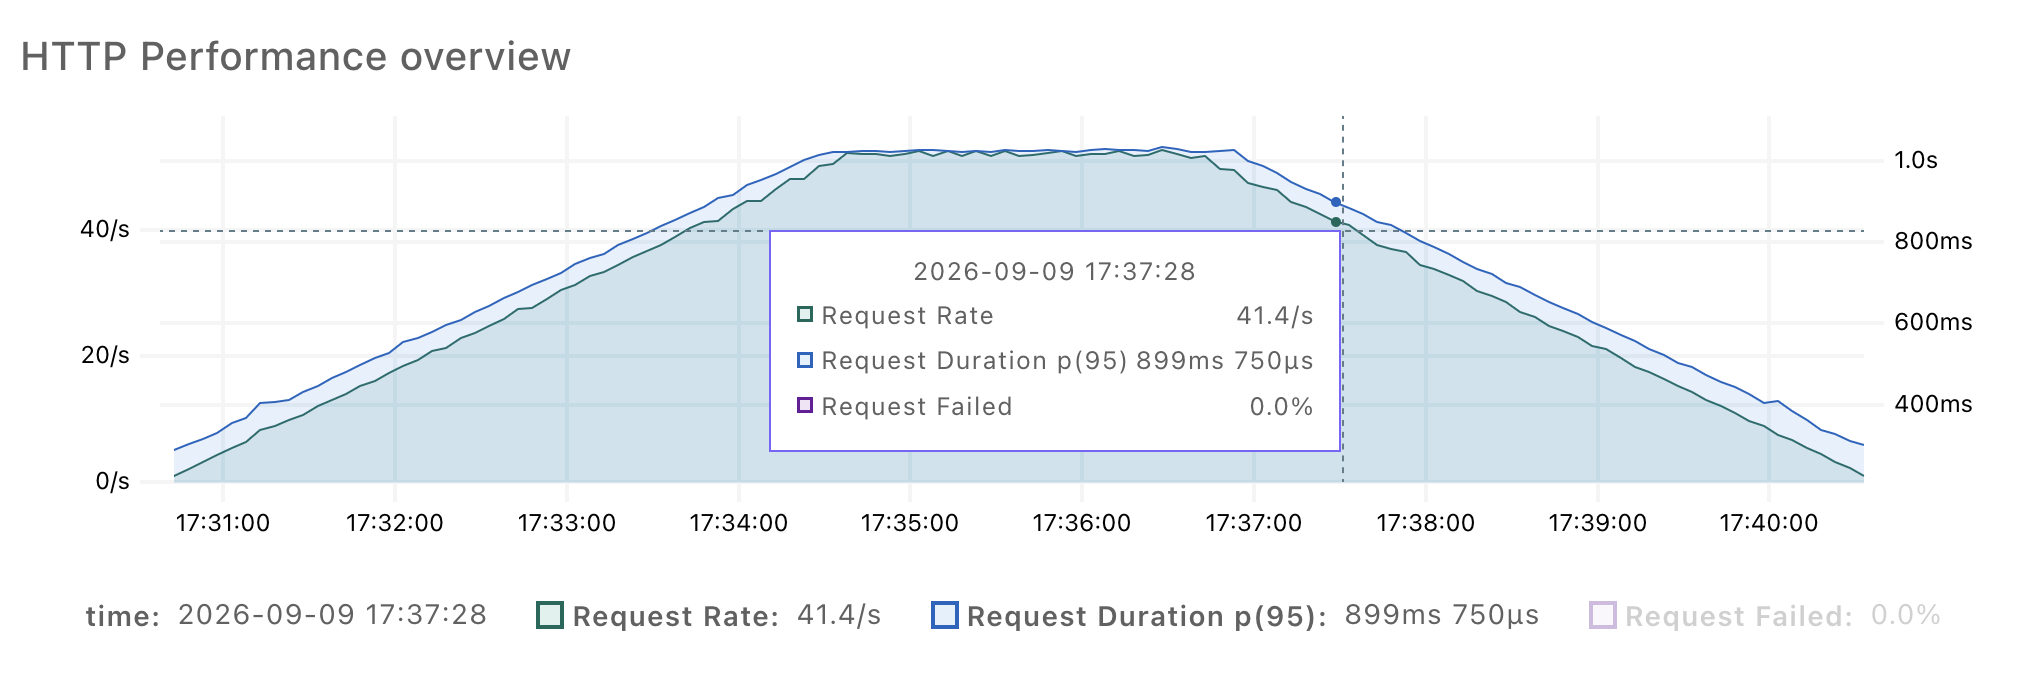
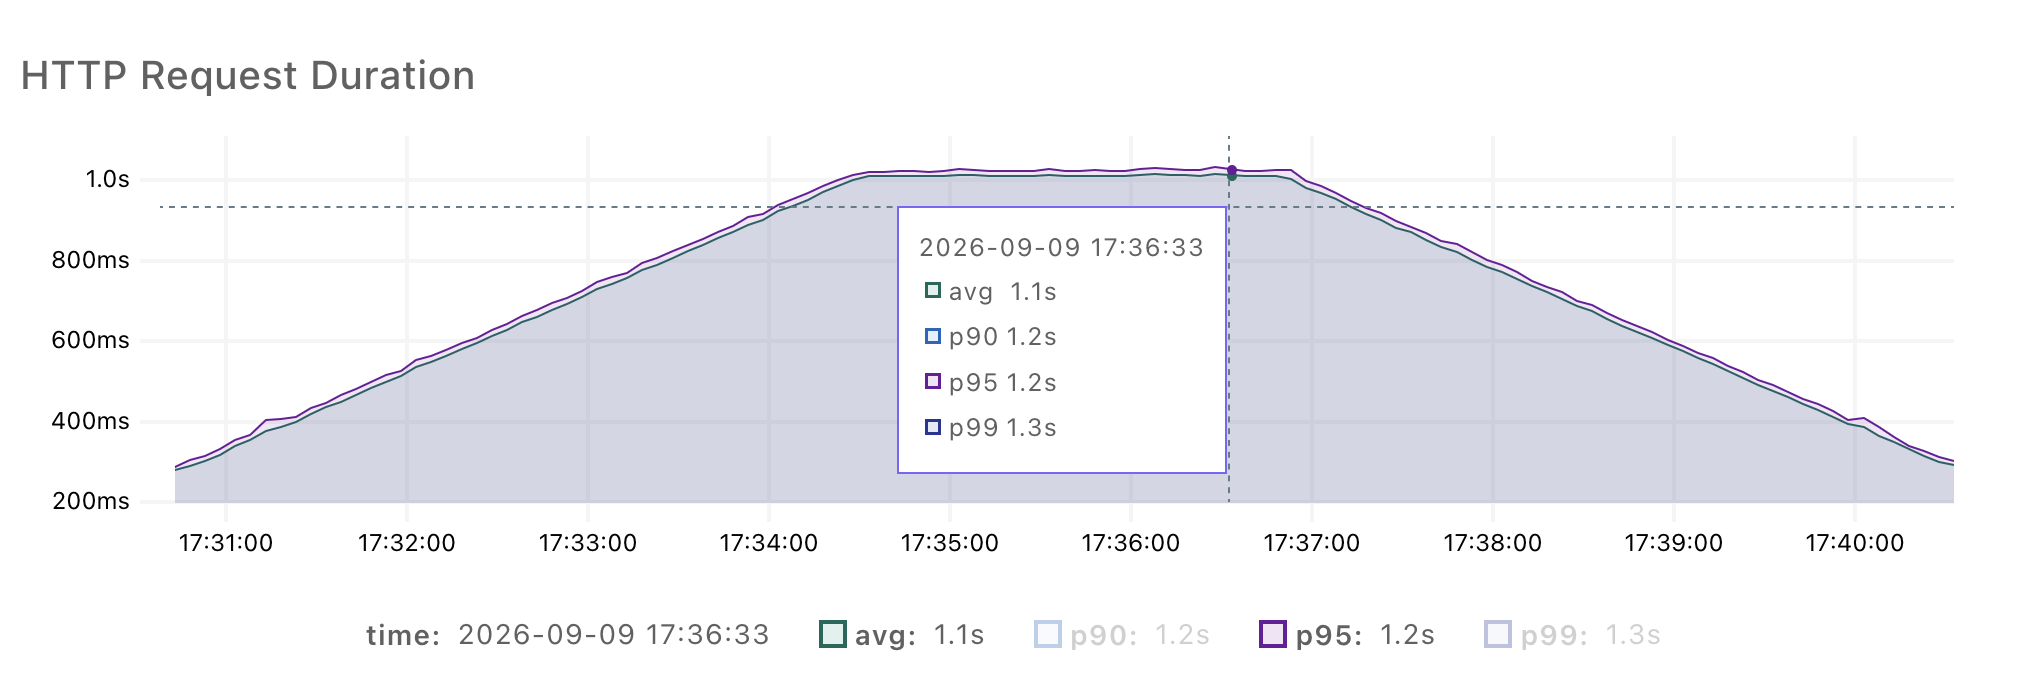
When interpreting your own results, focus on the shape and added delay. The duration measured by k6 also includes application processing, mock response handling, and network time.
Change at thresholds (step)
When we rerun the test in step mode, the observed durations form a staircase. The latency bands in this run were approximately 260, 409, 559, 709, 859, and 1,009 ms as the request rate increased. Each plateau is approximately 150 ms above the previous one. As in linear mode, the added delay is capped at 750 ms at and above 50 RPS, so the final plateau continues through the 52 RPS hold.
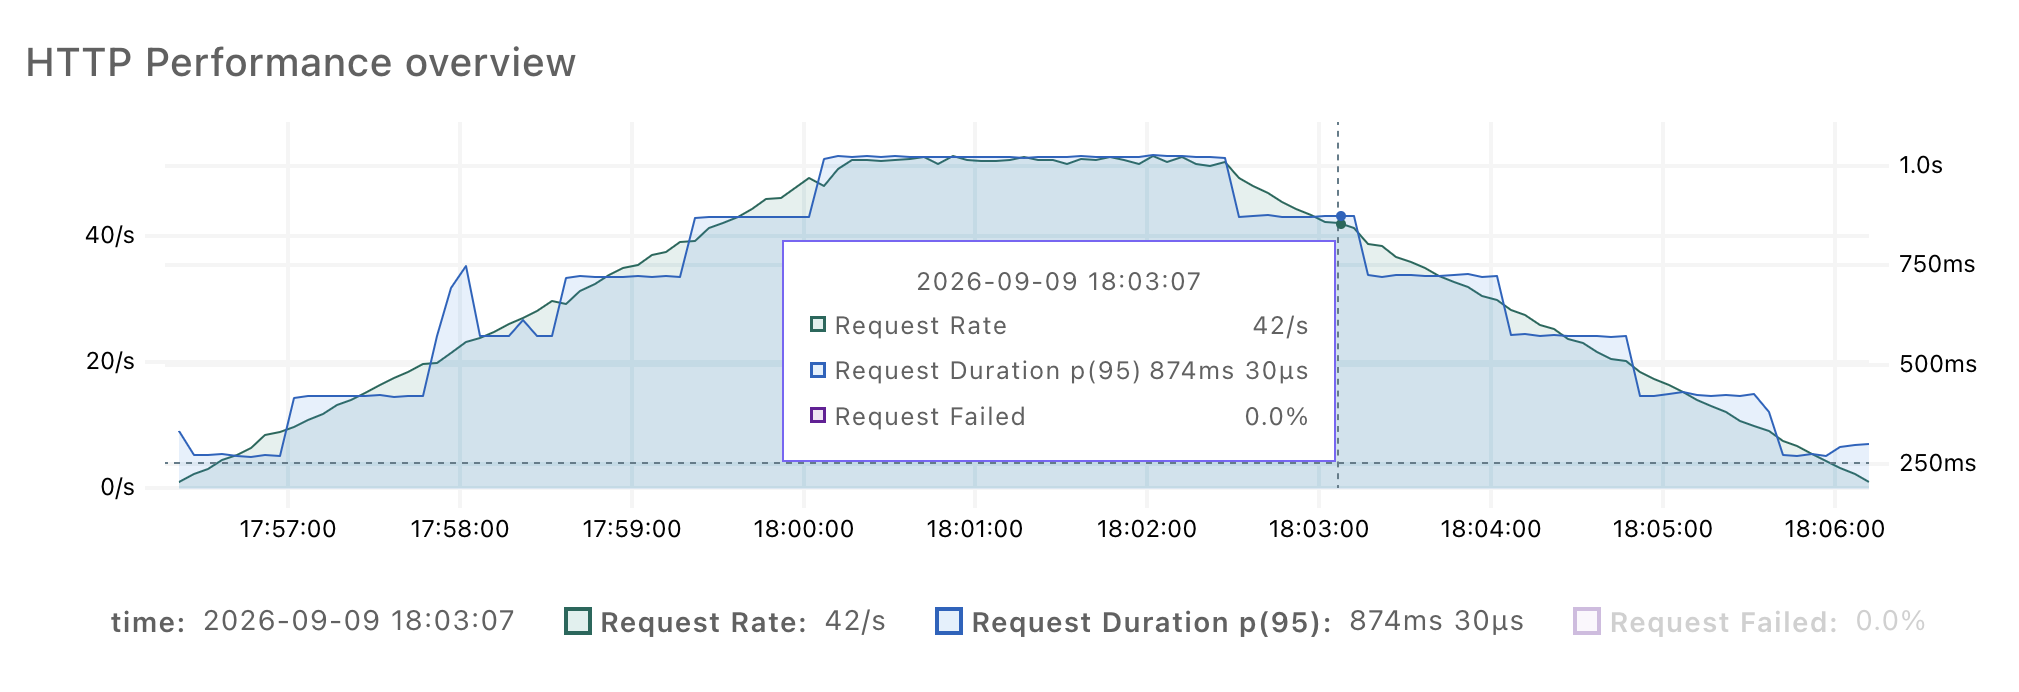
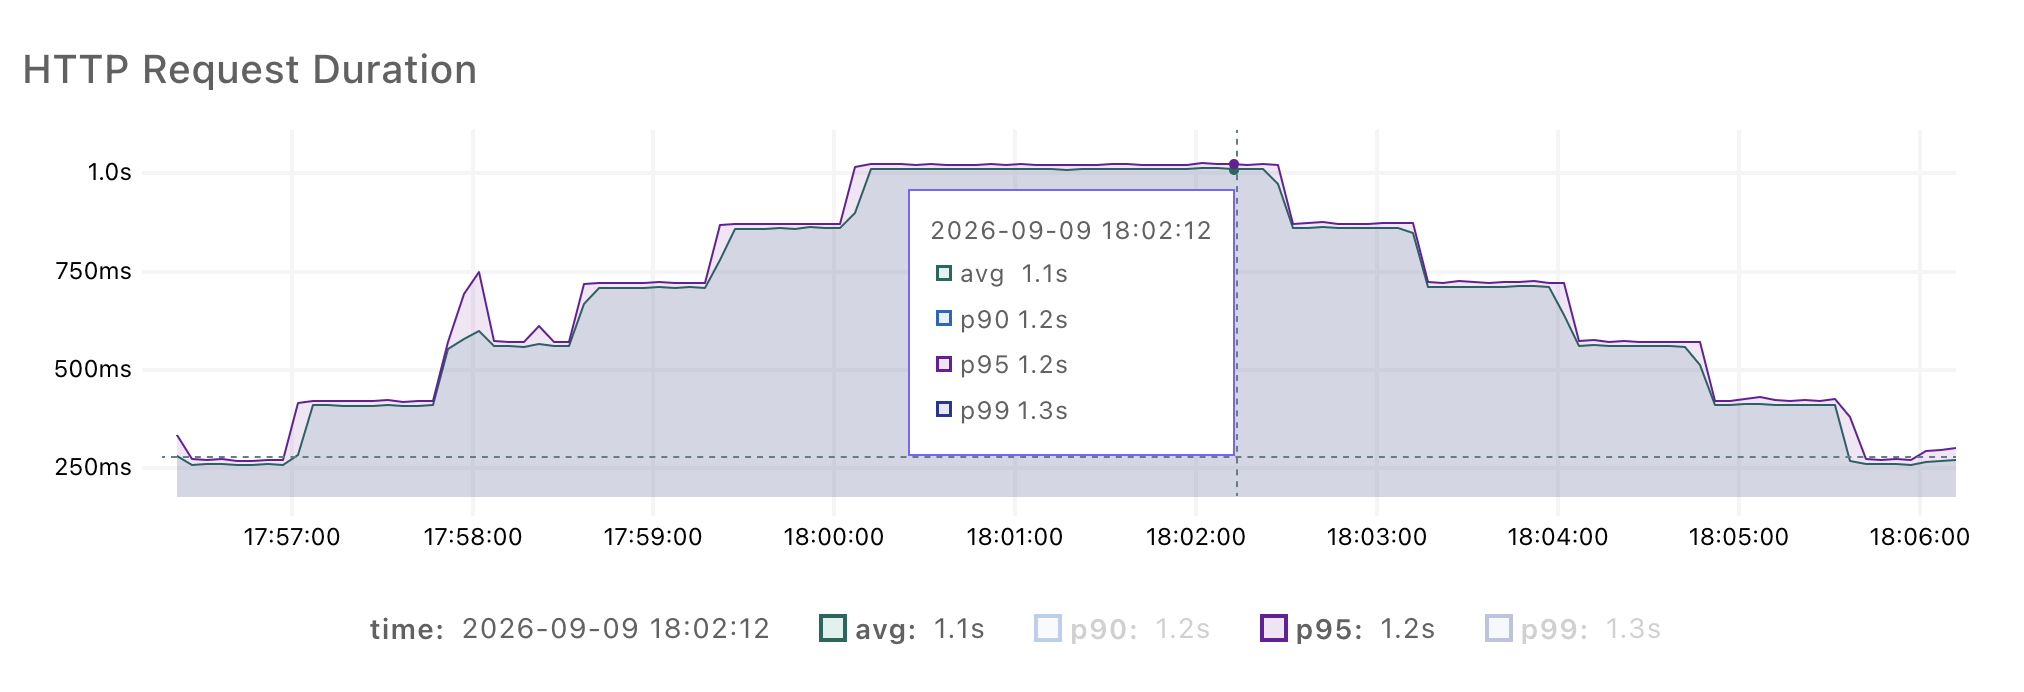
The report shows consistent latency bands and clear transitions at the configured request-rate thresholds.
Summary
This tutorial uses Beeceptor to simulate a CRM API whose added response latency changes with request load. Linear mode increases the delay smoothly between configured points, while step mode changes it at specific threshold. The k6 reports validates the as a practical result.
To build further on this test with Beeceptor, you can:
- Adjust the rate/latency pairs to reflect measurements from your CRM service.
- Compare request-rate-based latency with Beeceptor’s fixed, random-range, or log-normal profiles.
You should keep Beeceptor’s added delay distinct from the duration measured by k6. This makes it easier to explain which behavior comes from the configured CRM simulation and which comes from your application under test & your environments.